


Chabo Byaene Alain1, *, Mabela Makengo Matendo Rostin2, Konde Nkiama Numbi Joël3, Muhindo Mavoko Hypolite4, Kayembe Nzongola-Nkasu Donatien1, Tanon Aristophane Koffi5, Muwonga Masidi Jérémie1, Situakibanza Nani- Tuma Hippolyte4,6
1Department of Medical Biology, University Hospital of Kinshasa, Faculty of Medicine, University of Kinshasa. PO Box 834 Kinshasa XI, Kinshasa, Democratic Republic of the Congo (DRC).
2Department of Mathematics and Informatics, Faculty of Sciences, University of Kinshasa. PO Box 190 Kinshasa XI, Kinshasa, Democratic Republic of the Congo (DRC).
3Department of Health and Environment, Faculty of Medicine, University of Kinshasa. PO Box 834 Kinshasa XI, Kinshasa, Democrat ic Republic of the Congo (DRC).
4Department of Tropical Medicine, University Hospital of Kinshasa, Faculty of Medicine, University of Kinshasa. PO Box 834 Kinshasa XI, Kinshasa, Democratic Republic of the Congo (DRC).
5Department of Dermatology and Infectiology, Faculty of Medical Sciences, Félix Houphouët Boigny University. PO Box V 166 Abidjan-Cocody, Côte d’Ivoire.
6Department of Internal Medicine, University Hospital of Kinshasa, Faculty of Medicine, University of Kinshasa. PO Box 834 Kinshasa XI, Kinshasa, Democratic Republic of the Congo (DRC).
*Corresponding Author: Chabo Byaene Alain, Department of Medical Biology, University Hospital of Kinshasa, Faculty of Medicine, University of Kinshasa. PO Box 834 Kinshasa XI, Kinshasa, Democratic Republic of the Congo (DRC).
Abstract
Background: clinical laboratories are in a competitive environment and, therefore, need to measure customer loyalty and then build effective customer retention strategies to outperform rivals. This study aims to develop and validate an instrument to measure customer loyalty in a clinical laboratory.
Methods: Churchill's paradigm was adopted for developing a new customer loyalty measuring instrument. The conceptual model was checked for reliability, convergent validity, and discriminant validity using Exploratory Factor Analysis (EFA) and Confirmatory Factor Analysis (CFA).
Results: customer loyalty has a three-dimensional structure consisting of normative commitment, affective commitment, and continuance commitment. Cronbach’s alpha coefficients (0.929, 0.919, and 0.917) of the latent variables were greater than 0.8, which confirms the high reliability of the model. Indicator loadings were all greater than the threshold of 0.7. Also, all the latent variables have average variance extracted (AVE) greater than 0.5 achievings, therefore, convergent validity. Both the Maximum Shared Variance (0.195, 0.297, and 0.234) and the Average Shared Variance (0.828, 0.748, and 0.840) were lower than the AVE (0.910, 0.865, and 0.916) for all the constructs in the scale. Hence, Discriminant validity has been achieved. Fit indices used to assess CFA and structural equation model were found to be at an acceptable level for the two-factor model according to Kline criteria (χ2/df = 1.30, p= 0.579, GFI = 0.95, AGFI= 0.90, SRMR= 0.033, RMSEA= 0.012, CFI= 0.94, NFI= 0.98, RFI= 0.98, IFI= 0.98, TLC= 0.97).
Conclusion: The instrument demonstrated acceptable psychometric properties and, therefore, it fits to measure customer loyalty
Keywords: Customer loyalty, clinical laboratory, scale development, University Hospital of Kinshasa, measuring instrument, the Democratic Republic of the Congo, normative commitment, affective commitment, continuance commitment.
Introduction
Acquiring customers is an important business activity but retaining these customers is crucial to the business. Rosenberg et al. (1984) suggested that new customer acquisition can cost as much as six times the cost incurred in retaining an existing one [1]. Ehrenberg and Goodhart (2001) analyzed and concluded that the increase in profits can be attributed to lower costs associated with retaining existing customers, rather than constantly scouting for new ones, especially within mature, competitive markets [2].
The term customer loyalty refers to the act of a consumer choosing one company’s products and services consistently over their competitors. Loyal customers are less likely to be easily swayed by special offers, or promotions competitors run [3]. Customer loyalty should be the business’s top priority because, without loyal customers that continue to buy products from a company or to consume the company’s services, the business will not survive. Therefore, to survive or even thrive in the current economic environment, organizations need to revisit their customer retention strategies – and if necessary, renew their commitment to customer-centricity. The drop in income due to customer defection is real and must be addressed urgently [4].
A clinical laboratory has many clients. A central figure in the client list is the physician or healthcare provider. The initial request for service originates with this person, and the laboratory staff generally identifies the ordering physician as the primary customer [5]. Furthermore, it was found that clinical laboratories are in a competitive environment and face two questions related to strategy: (1) how can they win in the marketplace, and (2) how can they outperform rivals by creating sustainable competitive advantage? [6] The Clinical Laboratory of the University Hospital of Kinshasa (CLUHK) has existed for more than 50 years. But no customer loyalty strategy has been implemented. Since 2010, the attending physicians of the university hospital of Kinshasa refer patients to competing laboratories. Faced with this disloyalty of its customers, the clinical laboratory must measure its customers’ loyalty and implement effective customer retention strategies to survive in the current competitive environment.
The goal of this research is to develop and validate a customer loyalty measuring instrument. We need to answer the following research question: what dimensions are included in customer loyalty in the CLUHK?
Customer loyalty is defined as the extent to which the customer desires to maintain a continuing relationship with the firm or brand; in other words, customer commitment [7]. John Meyer and Natalie Allen defined the three types of commitment as follows: affective commitment, continuance commitment, and normative commitment [8]. Thus, to answer the research question, we propose the following main hypothesis: customer loyalty in the CLUHK has a three- dimensional structure consisting of normative commitment, affective commitment, and continuance commitment. The main hypothesis was refined into three sub-hypotheses:
H1: Normative commitment is directly and positively related to customer loyalty.
H2: Affective commitment is directly and positively related to customer loyalty.
H3: Continuance commitment is directly and positively related to customer loyalty.
Methods
Setting and study design
A cross-sectional study design was conducted at the University Hospital of Kinshasa from April 2019 to March 2020. We surveyed physicians because they are directly involved in the process of ordering laboratory tests and reviewing subsequent results in the physician home setting.
Sampling Method
Our sampling was exhaustive. The formal survey involved all available physicians (All Heads of concerned departments, senior residents, postgraduates, and junior residents)
- Who have worked at the medical institution for more than half a year,
- Who were regularly requiring laboratory investigations to be performed,
- Who were on duty during the study period and agreed to participate in the study.
Study procedures and statistical analysis
To develop a reliable and valid measurement instrument, we followed the general methodological approach recommended by Churchill [9]. We adopted Churchill's paradigm in which eight stages are proposed for developing better measures of marketing constructs (Figure 1). The eight stages are: specify the domain of construct, generate a sample of items, collect data, purify the measure, collect new data, assess reliability with new data, assess construct validity, and develop norms.
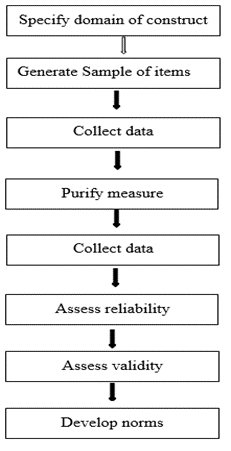
Figure 1: Suggested procedure for developing better measures.
First step: This step consisted of a literature review and a semi- structured interview with customers.
Second step: After the literature review and customers interview, we generated a structured instrument (questionnaire) based on Meyer and Allen's three types of commitment. We developed this questionnaire using a 7-point Likert scale to prevent respondents’ scores from clustering near the average: the loyalty was measured on a 7-point scale from 0 to 6 indicating the lowest (strongly disagree) and highest (strongly agree) levels of loyalty. The instrument went through the process of checking for content validity by using a focus group followed by panels of experts before checking the construct validity. The developed instrument consisted of 14 items i.e., 14 manifest variables.
Third step: The questionnaire was then piloted with a convenient sample of 200 attending physicians. The first data were collected after this survey carried out among 200 doctors.
Fourth step: this stride concerned the purification of the measurements. All data collected on the third step were analyzed by using SPSS 21.0 (SPSS Inc., Chicago, IL, USA). Using a 7-point Likert scale, the results were rated as follows: 0, strongly disagree; 16.6, disagree; 33.3, slightly disagree; 50, average; 66.6, slightly agree; 83.3, agree; and 100, strongly agree.
The main goal of the purification of the measurements was the dimensionality of the scales i.e., grouping similar measured variables into dimensions to identify latent variables or constructs. Exploratory factor analysis (EFA) is the statistical technique that we used to reduce the 14 manifest variables or items into fewer numbers offactors. This technique extracted maximum common variance from all 14 variables and put them into a common score. Before performing the exploratory factor analysis, we evaluated sample size adequacy using the Kaiser- Meyer-Olkin test of sampling adequacy (KMO). Furthermore, we assessed whether the factor analysis should be continued or not by employing Bartlett’s test of sphericity. Principal component analysis (PCA), with varimax rotation, was the EFA used to study the dimensionality of the construct i.e., to extract the factor from thedata set. Kaiser's criterion (retain the factors whose eigenvalue is greater than 1) was chosen to determine the number of factors. According to the PCA results, the developed instrument which consisted of 14 items measuring customer satisfaction was conceptually hypothesized to have three constructs i.e., three latent variables showing that customer loyalty is a three-dimensional variable. Hence the three hypotheses put forward in the introduction and the research framework (Figure 3).
Fifth step: Data were then collected from 330 attending physicians in the University Hospital of Kinshasa. Trained and qualified investigators conducted this study and distributed the developed instrument, which consisted of 14 items, to all physicians and then collected the following day. Surveyed doctors responded to the questionnaire by writing directly on the paper. The survey’s collected data were used to verify the conceptual hypothesis: the three-dimensional conceptual model resulting from the EFA was subjected to a Confirmatory Factor Analysis (CFA). Thus, in subsequent steps, the CFA results were used to demonstrate whether the model had acceptable reliability, convergent validity, discriminant validity, levels of fit, and unidimensionality.
Sixth step: The model was checked for reliability. The reliability checks were done using the data collected in the fifth step. We checked internal consistency reliability by analyzing the Cronbach’s Alpha, Jöreskog’s Rhô coefficient, and composite reliability values. A reliability coefficient of 0.70 or higher was considered “acceptable”.
Seventh step: The model was checked for validity. Convergent validity was achieved where indicator loadings were all greater than the threshold of 0.7 and all the latent variables had Average Variance Extracted (AVE) greater than 0.5. Discriminant validity was established where Maximum Shared Variance (MSV) and the Average Shared Variance (ASV) were both lower than the AVE for all the constructs.
Eighth step: The scale was also subjected to Structural Equation Modeling (SEM). Because there is no single criterion for the theoretical model fit evaluation obtained because of SEM, various fit indices were used to test the model fit according to the Kline criteria. To evaluate the structural model, we used the five-step structural model assessment procedure proposed by Hair et al.: 1) Assess structural model for collinearity issue; 2) Assess the path coefficient; 3) Assess the level of R2; 4) Assess the effect size f2; 5) Assess the predictive relevance Q2. All the threshold values against to each criterion were clearly represented with the results to have a comprehensive understanding of the evaluation of measurement.
In our study, we adopted the definitions of the main used concepts, presented below.
Patient poaching is the practice of directing the patient to another laboratory to perform analyses that are, however, feasible in the CLUHK.
Affective Commitment is defined as the attending physician's positive emotional attachment to the CLUHK. This is the "desire" component of customer loyalty.
Continuance commitment is defined as a desire to send patients to the CLUHK because of an awareness of the costs associated with patient poaching: the gains versus losses calculation of patient poaching.
Normative commitment is defined as a desire to send patients to the CLUHK due to a feeling of obligation. Ultimately, attending physician with a strong affective commitment still recommend the CLUHK to his patients because he wants to; attending physicianwith a strong continuance commitment still recommend because he needs to, and the one with a strong normative commitment still recommend because he feels he ought to do so [8].
Customer loyalty refers to “a deeply held commitment to re-buy or re- patronize a preferred product or service consistently in the future despite situational influences and marketing efforts having the potential to cause switching behavior. True customer loyalty is created when the customer becomes an advocate for theorganization, without incentive” [10]. So, in this study, customer loyalty is the attending physician's willingness to recommend the clinical laboratory's services to his patients.
Results
Table 1: KMO and Bartlett’s test
|
Kaiser-Meyer-Olkin Measure of Sampling Adequacy |
0.931 |
|
|
Bartlett’s test of Sphericity |
Approx. Chi-square |
9855.928 |
|
Df |
91 |
|
|
Bartlett’s Signification |
< 0.001 |
|
The Kaiser, Meyer and Olkin (KMO) test whose value is 0.931 and the Bartlett sphericity test (Bartlett = 9855.928; p < 0.001) indicates that the data can be factorized
Table 2: Total variance extracted.
|
Components |
Initial Eigenvalues |
Extraction Sums of Squared Loadings |
Rotation Sums of Squared Loadings |
||||||
|
Total |
% of variance |
Cumulative % |
Total |
% of variance |
Cumulative % |
Total |
% of variance |
Cumulative % |
|
|
1 |
9.649 |
68.921 |
68.921 |
9.649 |
68.921 |
68.921 |
4.867 |
34.762 |
34.762 |
|
2 |
2.423 |
17.306 |
86.228 |
2.423 |
17.306 |
86.228 |
4.514 |
32.241 |
67.004 |
|
3 |
1.366 |
9.754 |
95.982 |
1.366 |
9.754 |
95.982 |
4.057 |
28.978 |
95.982 |
|
4 |
0.107 |
0.766 |
96.748 |
|
|
|
|
|
|
|
5 |
0.073 |
0.522 |
97.271 |
|
|
|
|
|
|
|
6 |
0.072 |
0.512 |
97.782 |
|
|
|
|
|
|
|
7 |
0.061 |
0.434 |
98.217 |
|
|
|
|
|
|
|
8 |
0.050 |
0.360 |
98.577 |
|
|
|
|
|
|
|
9 |
0.045 |
0.323 |
98.900 |
|
|
|
|
|
|
|
10 |
0.039 |
0.282 |
99.182 |
|
|
|
|
|
|
|
11 |
0.037 |
0.261 |
99.444 |
|
|
|
|
|
|
|
12 |
0.033 |
0.239 |
99.682 |
|
|
|
|
|
|
|
13 |
0.025 |
0.178 |
99.860 |
|
|
|
|
|
|
|
14 |
0.020 |
0.140 |
100.000 |
|
|
|
|
|
|
The variance explained by the initial solution, extracted components, and rotated components is displayed. The second section of the table 2 shows the Initial Eigenvalues. For the initial solution, we have requested that eigenvalues greater than 1 be extracted, so the first three principal components form the extracted solution.
The third section of the table 2 shows the extracted components. We are interested in keeping only those principal components whose initial eigenvalues are greater than 1. Components with an eigenvalue of less than 1 account for less variance than did the original variable (which had a variance of 1), and so are of little use. The three extracted components explain nearly 96% of the variability in the original fourteen variables, so we can considerably reduce the complexity of the data set by using these components, with only a 4% loss of information.
The rotation maintains the cumulative percentage of variation explained by the three extracted components, but that variation is now spread more evenly over the components.
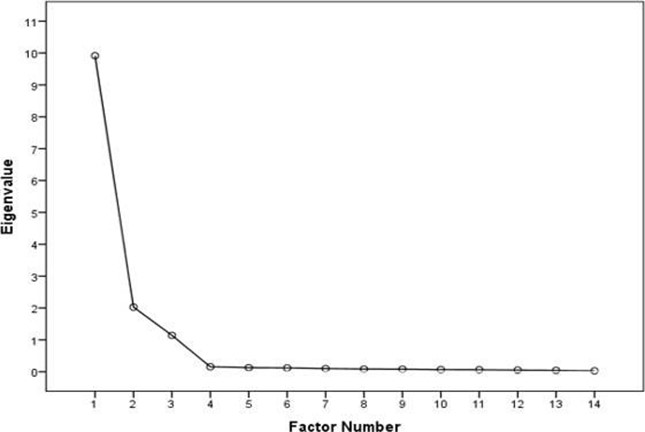
Figure 2: Scree Plot
The scree plot confirms the choice of three components.
Table 3: Components matrix after varimax rotation, standardized loadings* and construct reliabilities
|
Dimension |
Item (Code) |
Item Description |
Standardized loadings |
Composite reliability |
Cronbach’s Alpha |
Jöreskog Rhô |
|
Normative Commitment (NC) |
1 (NC1) |
I direct patients to the CLUHK because I feel a sense of moral obligation to direct patients to the CLUHK. |
0.900 |
0.95 |
0.929 |
0.858 |
|
2 (NC2) |
I direct patients to the CLUHK because patient poaching does not seem at all ethical to me. |
0.902 |
||||
|
3 (NC3) |
I direct patients to the CLUHK because patient poaching can betray the trust that people have placed in me. |
0.885 |
||||
|
4 (NC4) |
I will not poach patients because I feel that I have obligations to certain people who work in the CLUHK. |
0.891 |
||||
|
5 (NC5) |
I direct patients to the CLUHK because, as I’m a doctor of the University Hospital of Kinshasa, I am not allowed to do patient poaching. |
0.887 |
||||
|
Affective Commitment (AC) |
6 (AC1) |
I send my patients to CLUHK because I do not think that I could easily become as attached to another laboratory as I am to the CLUHK. |
0.756 |
0.83 |
0.919 |
0.838 |
|
7 (AC2) |
I send my patients to CLUHK because the CLUHK has a great deal of personal meaning for me. |
0.737 |
||||
|
8 (AC3) |
I send my patients to CLUHK because I really feel as if the CLUHK’s problems are my own. |
0.741 |
||||
|
9 (AC4) |
I send my patients to CLUHK because I do not feel a strong sense of referring my patients to another laboratory different from CLUHK. |
0.743 |
||||
|
Continuance Commitment (CC) |
10 (CC1) |
I continue to send patients to the CLUHK because I’m satisfied with CLUHK services. |
0.824 |
0.92 |
0.917 |
0.840 |
|
11 (CC2) |
I continue to send patients to the CLUHK because patient poaching has more disadvantages than advantages. |
0.830 |
||||
|
12 (CC3) |
I continue to send patients to the CLUHK because of its accuracy of tests ‘results. |
0.845 |
||||
|
13 (CC4) |
I send the patients to the CLUHK because it is overall superior to all the other laboratories that I know in this province. |
0.841 |
||||
|
14 (CC5) |
I would not find it correct to do patient poaching, even if another laboratory offers money to me. |
0.812 |
*The rotated component matrix helps us to determine what the components represent. Shown are Standardized loadings. Because these are correlations, possible values range from -1 to +1, On the /format subcommand, we used the options blank (0.70), which tells SPSS not to print any of the correlations that are 0.7 or less. This makes the output easier to read by removing the clutter of low correlations that are probably not meaningful anyway.
Three customer loyalty dimensions, comprising 14 variables, emerged from the factor analyses and scale reliability test. These factors were Normative Commitment (NC), Affective Commitment (AC), and Continuance Commitment (CC). Normative commitment which was made up of 5 items registered the highest Cronbach’s alpha score of 0.929. Affective Commitment which was made up of 4 items scored a Cronbach’s alpha value of 0.919 and registered the second-highest Cronbach’s alpha value. Continuance Commitment was made up of5 items and scored a Cronbach’s alpha value of 0.917, making it the third-highest Cronbach’s alpha score. The three factors registered a Cronbach’s alpha score greater than 0.90, indicating the scale has a very high degree of reliability. The Jöreskog Rhô and Composite Reliability are greater than 0.7 which allows us to further confirm the good reliability of the construct. Table 3 summarizes the previous results: it appears that the variable ‘customers’ loyalty’ is a three- dimensional concept. Based on preceding analysis, a comprehensive model for measuring customer loyalty is presented (see Fig. 3) below.
Table 4: Convergent and Discriminant validities
|
Latent Variables |
Average Variance Extracted (AVE) |
Maximum Shared Variance (MSV) |
Average Shared Variance (ASV) |
|
Normative Commitment (NC) |
0.910 |
0.195 |
0.828 |
|
Affective Commitment (AC) |
0.865 |
0.297 |
0.748 |
|
Continuance Commitment (CC) |
0.916 |
0.234 |
0.840 |
Table 3 shows that indicator loadings are all greater than the threshold of 0.7 or higher. Also, table 4 shows that all the latent variables have AVE greater than 0.5, therefore, convergent validity has been achieved.
Table 4 shows that the AVE of each latent variable is greater than the highest squared correlations between any other construct. Furthermore, both the MSV and the ASV are lower than the AVE for all the constructs in the scale. Therefore, Discriminant validity has been achieved.
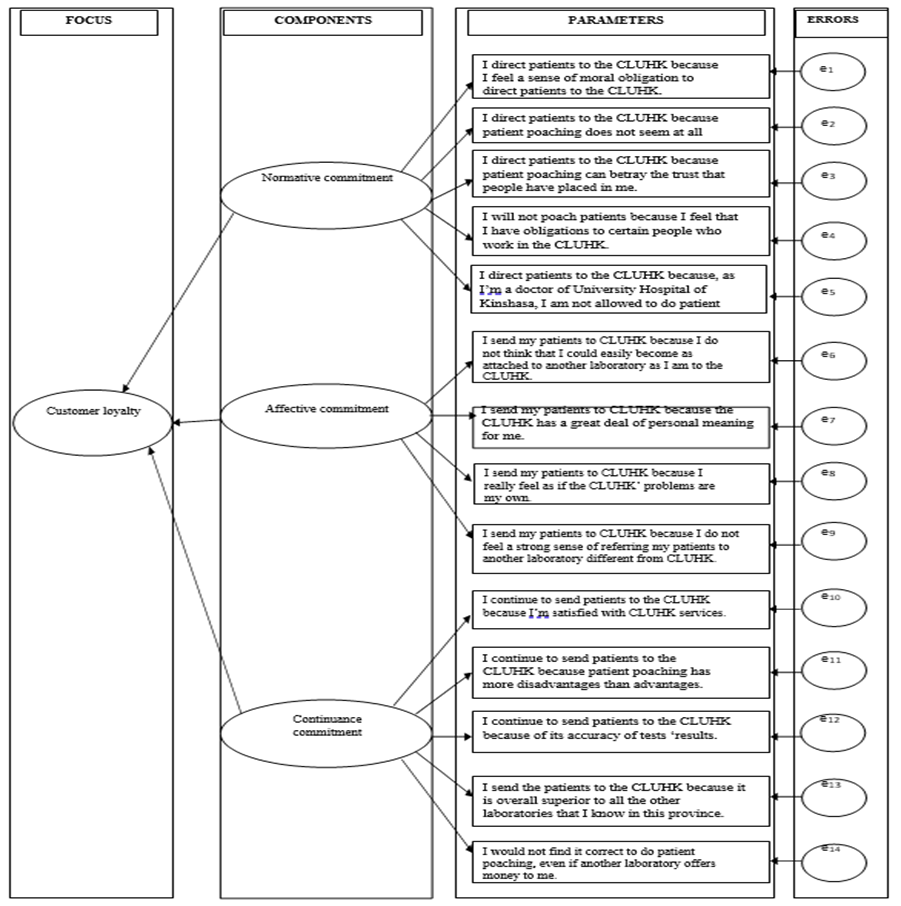
Figure 3 : Comprehensive model for measuring customer loyalty
Table 5: Summary of model adjustment indicators
|
Fit |
Indices |
Cut-off for good fit* |
Null model |
One-factor model |
Two-factor model |
|||
|
value |
Global fit |
value |
Global fit |
value |
Global fit |
|||
|
Absolute |
|
p > 0.05 |
255.26 (p<0.001) |
No |
178.04 (p<0.001) |
No |
186.13 (p=0.579) |
Yes |
|
GFI |
≥ 0.90 |
- |
- |
0.93 |
Yes |
0.95 |
Yes |
|
|
AGFI |
≥ 0.90 |
- |
- |
0.85 |
No |
0.90 |
Yes |
|
|
SRMR |
< 0.10 |
- |
- |
0.045 |
Yes |
0.033 |
Yes |
|
|
RMSEA |
≤ 0.08 |
- |
- |
0.16 |
No |
0.012 |
Yes |
|
|
Incremental |
CFI |
≥ 0.90 |
- |
- |
0.84 |
No |
0.94 |
Yes |
|
NFI |
≥ 0.90 |
- |
- |
0.89 |
No |
0.98 |
Yes |
|
|
TLC |
≥ 0.90 |
- |
- |
0.119 |
No |
0.97 |
Yes |
|
|
RFI |
≥ 0.90 |
- |
- |
0.884 |
No |
0.979 |
Yes |
|
|
IFI |
> 0.90 |
- |
- |
0.928 |
Yes |
0.978 |
Yes |
|
|
Parsimony |
χ2/df |
< 2 |
9.82 |
No |
10.47 |
No |
1.30 |
Yes |
* Cutoff criteria for good model fit recommended by Kline (2005).
The goodness of Fit Indices (GFIs) for a series of Confirmatory Factor Analysis (CFA) assessing the null, one-factor, two-factor (generated by combining in all possible ways the three theoretically defined components) models of customer loyalty is presented in table 5. According to Kline criteria, the two-factor model provided for a good fit.
Table 6. Results of hypothesis testing and predictable power
|
Hypo- thesis |
Relation- ship |
VIF |
β-value |
t-valuea |
p-value |
R2 |
Effect sizeb f2 |
Effect sizec q2 |
Std error |
Decision |
|
H1 |
NC CL |
2.226 |
0.015 |
5.58* |
0.058 |
0.609 |
0.015 |
0.012 |
0.033 |
supported |
|
H2 |
AC CL |
1.564 |
0.018 |
2.88* |
0.077 |
0.393 |
0.02 |
0.00 |
0.026 |
supported |
|
H3 |
CC CL |
1.781 |
0.046 |
7.31*** |
<0.001 |
0.938 |
0.00 |
0.00 |
0.028 |
supported |
t-values for two-tailed test:
*1.65 (sig. level = 10%)
**1.96 (sig. level = 5%)
***2.57 (sig. level = 1%) (Hair et al., 2017) Notes: ***p<0.01, **p<0.05, *p<0.10
Effective size: 0 - none, 0.02 – small, 0.15 – medium, 0.35 – large (Cohen, 1988) Effect sizes calculated using the following formulas:
bf2 = R2 included – R2 excluded/1 – R2 included
cq2 = Q2 included – Q2 excluded/1 – Q2 included
Table 6 shows that the three constructs have a Variance Inflation Factor value of less than 5 (VIF <5). Thus, this finding shows no correlation between the three latent variables. H1 suggests that normative commitment has a positive impact on customer loyalty. We found a significant relationship (β = 0.015, t = 5.58, p = 0.058) between the normative commitment and the customer loyalty. Thus, H1 is supported by our data.
H2 suggests that affective commitment has a positive impact on customer loyalty. We found a significant relationship (β = 0.018, t = 2.88, p = 0.077) between the affective commitment and the customer loyalty. Therefore, H2 is supported by our data. H3 suggests that continuance commitment has a positive impact on customer loyalty. We found a significant relationship (β = 0.046, t = 7.31, p <0.001) between the continuance commitment and the customer loyalty. Thus, H3 is supported by our data. R-square values (0.609, 0.393 and 0.938) are considered as substantial (greater than 0.26). Thus, the high predictive power of the model. We next assessed the effect f2 of each relationship. The results presented in Table 6 show that we found at least small f2 effects for all significant relationships. Regarding the q2 effects, we found a small effect between normative commitment and customer loyalty.
Discussion
As its main objective, this research proposes the development and validation of a customer loyalty measuring instrument for the Clinical Laboratory of the University Hospital of Kinshasa (CLUHK).
In this preliminary study, we propose a model in which customer loyalty depends on customer commitment. The set of manifest variables for each of the three latent variables representing normative commitment, affective commitment, and continuance commitment are described in figure 3. In our model all the manifest variables are treated as reflective i.e., the latent variables are to be considered as the cause of the manifest variables belonging to their own block [11].
This study employed structural equation modeling (SEM) as the main data analysis method. The two-stage testing process suggested by Anderson and Gerbing was performed to apply SEM. In the first stage, the measurement model’s reliability and validity were tested. In the second stage, the structural model was tested in terms of examining the hypothesized paths among the constructs [12].
According to Hair et al., the reflective measurement model should be evaluated from three perspectives: namely, (1) internal consistency reliability; (2) convergent validity; and (3) discriminant validity. The purposes of these assessments are to ensure that the indicators of each construct measure their relevant constructs more accurately [13]. In addition, it is necessary to confirm that all the constructs in the model are uncorrelated with each other. In other words, these assessments suggest whether the measurement model could be applied to examine the relationship between the independent and dependent variables [14]. The most important aspect of questionnaires is their internal consistency, which is a measure based on the correlations between different item scores on the same test (or the same subscale on a larger test). It measures whether several items that propose to measure the same general construct produce similar scores. Internal consistency is commonly assessed using Cronbach’s α, a statistic calculated from the pair-wise correlations between items. Internal consistency ranges between zero and one. A rule of thumb is that an α of 0.6-0.7 indicates acceptable reliability, and 0.8 or higher indicates good reliability [15]. Table 3 gives the values of the alpha coefficient. It is noteworthy that the alphas all exceeded 0.9, indicating good reliability. However, it is possible to present reliability more explicitly. To take this initiative, it is common to calculate the Jöreskog Rhô coefficient (ρ), which is less sensitive than Cronbach’s alpha to the components of a scale. The generally acceptable thresholds for Jöreskog Rhô are the same as those used to access Cronbach’s alpha: a value greater than 0.8 recommended for a confirmatory step in the scale development process [16]. The Jöreskog Rhô (table 3) ranged between 0.838 and 0.858, which significantly exceed the 0.8 thresholds, achieving acceptable internal consistency. The composite reliability, which is the more preferred measure of reliability also ranged from 0.83 to 0.95, therefore indicating that the constructs are reliable [17].
Another important aspect of questionnaires is their construct validity. Validity concerns the soundness of the accuracy of a measure or the extent to which a score truthfully represents a concept [18]. Construct validity examines how well the results obtained from the use of a measure fit the theories upon which the test is designed. As such, it provides answers to whether the instrument used in the test tap the actual concept theorized in the study. To achieve validity analysis, two kinds of validity tests were performed on the measurement scales namely: convergent validity and discriminant validity [19]. Convergent validity refers to the extent to which the measured variables of a specific factor have a high proportion of variance in common and assess the same factor, while discriminant validity refers to the degree to which a factor is truly distinct from other factors [20]. In examining the convergent validity of a measure, the average variance extracted (AVE) and item loadings are assessed. AVE is the average variance shared between a construct and its measures. It is defined as the grand mean value of the squared loadings of the indicators associated with a particular construct (the sum of the squared loadings divided by the numbers of indicators). AVE value equal to or higher than 0.50 indicates that on average, the construct explained more than half of the variance of its indicators. Conversely, an AVE of lesser value than 0.50 indicates that more error remains in the items than the average variance explained by the constructs. As such, the rule of thumb is that an AVE value greater or equal to 0.50 is acceptable [21]. Table 3 showed that item loadings are all greater than the threshold of 0.7. Also, table 4 showed that all the latent variables have AVE greater than 0.5, therefore, convergent validity has been achieved. Discriminant validity was established where Maximum Shared Variance (MSV) and the Average Shared Squared Variance (ASV) were both lower than the Average Variance Extracted (AVE) for all the constructs [17] as shown in table 4. In summary, the measurement model demonstrated adequate reliability, convergent validity, and discriminant validity. After assessing the reliability and validity, we tested the overall fit of the path model to establish that the measurement model fits the actual data. The model fit was evaluated using the Goodness of Fit Index [22]. Practitioners have the following fit indices to evaluate for model adequacy: (1) absolute fit indices: based on how adequately the a priori/hypothesized model fits the data; (2) comparative/incremental/relative fit indices: obtained by comparing the independence model to the hypothesized and respecified models; and (3) parsimonious fit indices: based on adjustments of absolute and comparative fit indices [23]. According to Hair et al., at least one incremental index (CFI or TLI) and one absolute index (RMSEA or SRMR) must be reported [17]. However, the availability of many different fit indices presents problems of selection to researchers because there is a lack of consensus regarding which absolute and incremental goodness-of-fit indices are optimal for gauging model-fit and should be reported. Therefore, multiple alternative fit indices were employed to measure the degree of model fit [24]. For the model to be considered as having an acceptable fit, all eleven indices were measured against the Kline criteria [25] as shown in Table 5. This table shows that the null model fit very poorly, and each of the other models represented a highly significant improvement in fit over the null model. Inspection of the various Goodness of Fit Indices (GFIs) indicated that in line with our predictions, the two-factor model fit the data quite well and represented a highly significant improvement in fit over all the null and the one-factor model. Thus, the two-factor model was preferred for this set of items.
Hence the measurement model was fit; we proceeded to evaluate the structural model. The structural model and its latent variables represent the stable, theoretically, and conceptually established contextual link between observed data on the input and output sides. Based on the structural model the goal of the analysis is to predict the output layer data by means of the input layer data. In other words, the structural model is used to illustrate one or more dependent relationships liking the hypothesized model’s construct. To assess the structural model Hair et al. proposed a five-step structural model assessment procedure [17].
1) Assess structural model for collinearity issue 2) Assess the path coefficient 3) Assess the level of R2 4) Assess the effect size f2 5) Assess the predictive relevance q2.
According to our results, table 6 shows that the values of the VIF are less than 5.0 which is the equivalent threshold when the formative models are assessed. Furthermore, we found a significant relationship between explanatory variables and explained variables.
Since the issue of achieving meaningful results is measuring, or rather estimating, the size of the effect, we assessed the effect sizes f2 and q2 of each relationship [26]. In fact, Hair et al recommend assessing the f2 effect size and q2 effect size of each relationship to compare the predictive relevance of the single relationships. Values of 0.02, 0.15 and 0.35 resemble a small, medium, or large f2 or q2 effect size, respectively [17]. Results of hypothesis testing and predictable power confirmed the positive relationship between the three dimensions of organizational commitment and customer loyalty.
The major inherent limitation of this research is the generalization of the outcome of the study. This study was limited to only the University Hospital of Kinshasa and not the entire hospital market in Kinshasa. Future research should, therefore, reproduce the study in other hospitals to confirm the results of our findings across the health system. Finally, the test-retest reliability of the instrument should be evaluated. Measures of reliability include the stability of an instrument over time. Therefore, the stability of this new instrument, including short- and long-range stability, should be further investigated using the test-retest correlation method.
Despite the above limitations, this study provides valuable practical and managerial implications for researchers and laboratory managers. It highlights principal areas where managerial attention is required for improving customer loyalty. It is important for clinical laboratory managers to consider customer loyalty as a three-dimensional construct, where normative commitment, affective commitment, and continuance commitment are important because focusing only on one or another commitment is too narrow an approach. We recommend that the laboratory measure its customers’ loyalty and implement effective customer retention strategies to outperform rivals and thus to survive in the current competitive environment.
The present study has some theoretical implications as well. This paper, being the first study to attempt a comprehensive psychometric validation of an instrument that measures clinical laboratory customers' loyalty in the Democratic Republic of the Congo has contributed to filling the gap in the literature. Additionally, findings on the loyalty dimensions that are of the highest importance to customers are still subjective, and the current study theoretically contributes to increasing the knowledge insight in the field of marketing.
Conclusion
This study aimed at developing and validating a customer loyalty measuring instrument and particularly identifying dimensions of customer loyalty in the clinical laboratory. As a result, three customer loyalty components were identified through exploratory and confirmatory factor analysis. The three included normative commitment, affective commitment, and continuance commitment. Measures of the three components were developed and found to be psychometrically sound. Fourteen items were found to satisfy requirements for testing reliability and validity. Cronbach’s Alpha values of each construct confirmed that good reliability existed with the data. Also, predictive, convergent, and discriminant validity for the factors under investigation were confirmed. A structural equation model was developed showing the relationships between the three components and customer loyalty and all three were significant. These findings confirm our main hypothesis that customer loyalty in the clinical laboratory of the University Hospital of Kinshasa has a three-dimensional structure consisting of normative commitment, affective commitment, and continuance commitment.
Ethical consideration
Before implementing the study, ethical clearance was obtained from the ethical review committee of the Public Health School, University of Kinshasa. Permission was obtained from management at each department of the hospital participating in the study. Informed consent was also obtained from each respondent, and confidentiality was maintained throughout the study. The methodology used in this study followed the principles of the Helsinki Declaration.
References
- Rosenberg LJ, Czepiel JA (1984) A marketing approach for customer retention. Journal of Customer Marketing. 1(2): 45-51.
- Ehrenberg A, Goodhardt G (2001) New Brands: Near-Instant Loyalty. J Target Meas Anal Mark. 10(1): 9-16.
- Jones TO, Sasser WE (1995) Why satisfied customer’s defect. Harvard Business Review. 73(6): 88
- Rai AK, Srivastav M (2014) Customer Loyalty: Concept, Context and Character. New Delhi: McGraw Hill India.
- World Health Organization. Laboratory quality management system handbook. Lyon: World Health Organization; 2014.
- Christensen CM, Grossman JH, Hwang J (2016) The Innovator’s Prescription: A Disruptive Solution for Health Care. New York: McGraw-Hill Education.
- Uncles MD, Dowling GR, Hammond K (2003) Customer loyalty and customer loyalty programs. Journal of Consumer Marketing 20(4): 294-316.
- Allen NJ, Meyer JP (1990) The measurement and antecedents of affective, continuance and normative commitment to the organization. Journal of Occupational Psychology. 63(1): 1-18.
- Churchill GA (1979) A Paradigm for Developing Better Measures of Marketing Constructs. JMR. 16(1): 64-73.
- Oliver RL (2010) Satisfaction: a Behavioral Perspective on the Consumer 2nd ed. New-York: Routledge.
- Carpita M, Brentari E, Qannari EM (2016) Advances in Latent Variables : Methods, Models and Applications. Cham: Springer International Publishing.
- Anderson JC & Gerbing DW (1988) Structural equation modeling in practice: a review and recommended two-step approach. Psychol Bull. 103 (3): 411-23.
- Hair JF, Ringle CM, Sarstedt M. (2013) Partial least squares structural equation modeling: Rigorous applications, better results and higher acceptance. Long Range Planning. 46(1-2): 1- 12.
- Suzuki K, Pheng LS (2019) Japanese Contractors in Overseas Markets: Bridging Cultural and Communication Gaps. Singapore: Springer Nature.
- Eggermont JJ, Roberts LE (2012) The neuroscience of tinnitus: understanding abnormal and normal auditory perception. Front Syst Neurosci. 6(53): 1-4.
- Frikha A (2019) Measurement in Marketing: Operationalization of Latent Constructs. London: Wiley-ISTE.
- Hair JF, Hult GTM, Ringle CM, Sarstedt M (2016) A Primer on Partial Least Squares Structural Equation Modeling (PLS-SEM) 2nd ed. New Dehli: Sage Publications Inc.
- Zikmund WG, Babin BJ, Carr JC, Griffin M (2013) Business Research Methods, 9th ed. Boston: Cengage Learning.
- Sekaran U, Bougie R (2010) Research methods for business: A skill-building approach 5th ed. Haddington: John Wiley & Sons.
- Hair JF, Black WC, Anderson RE, Babin BJ (2018) Multivariate data analysis 8th ed. Andover: Cengage Learning EMEA.
- Hair JF, Sarstedt M, Pieper TM & Ringle CM. Applications of partial least squares path modeling in management journals: a review of past practices and recommendations for future applications. Long Range Planning. 2012; 45(5-6): 320-40.
- Tabachnick BG, Fidell LS (2018) Using Multivariate Statistics 7th ed. London: Pearson.
- Flynn A, Kramer S, Laher S (2019) Transforming Research Methods in the Social Sciences: Case Studies from South Africa. Johannesburg: Wits University Press.
- Wipulanusat W, Panuwatwanich K, Stewart RA (2017) Workplace innovation: Exploratory and confirmatory factor analysis for construct validation. Management and Production Engineering Review. 8(2): 57-68.
- Kline RB (2016) Principles and Practice of Structural Equation Modeling 4th ed. New York: Guilford Press.
- Ialongo C (2016) Understanding the effect size and its measures. Biochem Med (Zagreb). 26(2): 150–63. https://www.biochemia- medica.com/en/journal/26/2/10.11613/BM.2016.015