


Zhenwei Dai*
School of Population Medicine and Public Health, Chinese Academy of Medical Sciences & Peking Union Medical College, Beijing, China
*Corresponding Author: Zhenwei Dai, School of Population Medicine and Public Health, Chinese Academy of Medical Sciences & Peking Union Medical College, Beijing, China.
Abstract
Background: Depressive disorders have become the second major risk factor that influences people’s health worldwide, but Few studies have focused on the prevalence of depressive disorders among the Chinese elderly and their characteristics of depressive disorders.
Objective: The current study is aimed at exploring the characteristics of depressive disorders in the Chinese elderly by latent profile analysis (LPA).
Methods: The subsection “CESD Depression” from the section “Cognition and Depression” of the CHARLS 2018 database was used for analysis. Latent profile models (LPM) were specified to identify subgroups.
Results: The prevalence of depressive disorders among the Chinese elderly was 34.8%. The 3-class model was selected as the optimal model, and the classes are defined as “no depressive disorder”, “mild depressive disorders”, and “moderate to severe depressive disorders”.
Conclusion: The depressive disorders of the Chinese elderly have obvious categorical characteristics, which can provide a new idea for the precise intervention of depressive disorders in the Chinese elderly.
Keywords: Depressive disorders; The elderly; China; Latent profile analysis
Introduction
Depressive disorders have become the second major risk factor that influences people’s health worldwide, which can not only harm people’s physical and mental health but also bring a heavy global burden of diseases [5]. A cross-sectional study with a nationally representative sample indicated that the prevalence of depressive disorders was 6.8 % in China [7]. China has almost a fifth of the population worldwide with a large elderly population, and the problems of depressive disorders among the elderly deserve attention [5]. A systematic review suggested that the prevalence of depressive disorders in the Chinese elderly was 36.8 % [13]. The depressive disorders of the elderly can be obtained by psychological scale, but the cut-off value of scales can only reflect the overall level of depressive disorders instead of accurately identifying the characteristics of depressive disorders.
Additionally, even if two respondents respond with the same score on a scale, their answers on each item may be different. Latent profile analysis (LPA) is a statistical method that employs the latent profile model (LPM) to divide a population into multiple subgroups, and it focuses on identifying latent profiles within a population based on a certain set of continuous variables [3]. Currently, few studies have focused on the prevalence of depressive disorders among the Chinese elderly and their characteristics of depressive disorders. Following our protocol, this study is aimed at evaluating the prevalence of depressive disorders in the Chinese elderly and exploring the characteristics of depressive disorders in the Chinese elderly by LPA, thus providing a reference for further research and specific interventions on the elderly of different characteristics [6].
Methods
Data
This study used data from wave 4 of the China Health and Retirement Longitudinal Study (CHARLS 2018) database. CHARLES is a longitudinal survey aimed at being representative of the residents in mainland China aged 45 or older. The survey employed stratified multistage cluster sampling and the final sample fell within 150 counties of 28 provinces in China [15]. Written informed consent has been obtained from all participants. Ethical approval for the CHARLS survey was granted by the Institutional Review Board at Peking University (IRB approval number: IRB00001052-11015). The subsection “CESD Depression” from the section “Cognition and Depression” of the CHARLS 2018 database was used for analysis in the current study, which contains 19744 participants.
Measure
Center for Epidemiologic Studies Depression Scale (CES-D10) was used to measure the depressive disorders of participants in CHARLS [10,14]. The scale contained 10 items and each item was a 4-point Likert scaled (0=Never or seldom; 3=Most or all of the time). Higher total scores indicated a higher level of depressive disorders, a total score equal to or higher than 10 could indicate depressive disorders [2]. The Cronbach’s α of the scale in CHARLS 2018 was 0.810.
Statistical Analysis
LPM was specified to identify characteristics of depressive disorders among the Chinese elderly. Robust maximum likelihood estimation was employed to estimate the parameters. The Lo-Mendell-Rubin (LMR) and the bootstrap likelihood ratio test (BLRT) were performed to compare the model fit improvement between models with k classes and k-1 classes, significant p values indicated a better model fit with k classes. The optimal number of classes was evaluated by the entropy, Akaike Information Criterion (AIC), Bayesian Information Criterion (BIC), and the adjusted Bayesian Information Criterion (aBIC). The receiver operating characteristic (ROC) curve and Kappa test were employed to further assess the accuracy and precision of the models. Additionally, the interpretability of classes is also an important factor in determining the number of classes. Expectation maximization (EM) imputation was used to interpolate missing values. All the statistical analyses were completed using SAS 9.4 and Mplus 8.3.
Results
Prevalence of depression and model fit indices of latent profile models
The prevalence of depressive disorders among the Chinese elderly was 34.8 % based on the cut-off value of CES-D10. Model fit indices for various models with different classes are displayed in table 1.
Table 1: Fitness indicators of different latent profile models
|
Class |
AIC |
BIC |
aBIC |
Entropy |
LMR |
BLRT |
class membership probability |
|
1 |
567528.11 |
567685.92 |
567622.36 |
|
|
|
1 |
|
2 |
522868.17 |
523112.78 |
523014.26 |
0.917 |
< 0.001 |
< 0.001 |
0.760/0.240 |
|
3 |
505411.83 |
505743.24 |
505609.77 |
0.923 |
< 0.001 |
< 0.001 |
0.186/0.692/0.122 |
|
4 |
498903.35 |
499321.55 |
499153.12 |
0.933 |
< 0.001 |
< 0.001 |
0.688/0.056/0.189/0.067 |
|
5 |
480031.08 |
480536.08 |
480332.69 |
0.964 |
< 0.001 |
< 0.001 |
0.063/0.088/0.136/0.654/0.059 |
|
6 |
479873.7 |
480465.49 |
480227.14 |
0.998 |
< 0.001 |
< 0.001 |
0.112/0.430/0.267/0.038/0.068/0.084 |
|
7 |
476629.07 |
477307.66 |
477034.36 |
0.889 |
> 0.999 |
> 0.999 |
0.070/0.077/0.423/0.253/0.068/0.056/0.053 |
|
8 |
472402.95 |
473168.34 |
472860.08 |
0.95 |
> 0.999 |
> 0.999 |
0.102/0.390/0.189/0.057/0.057/0.100/0.059/0.048 |
Selection of model and definition of classes
The result of Table 1 indicated that the entropies of all classifications were above 0.8. The LMR and BLRT test was not statistically significant after the 7-class model was assigned, hence the optimal classification would be identified from the first 6 models. The AIC, BIC, and a BIC decreased with the increase in class number, and the 6- class model had the largest entropy value. The conditional means of latent classes from 2-class to 6-class are illustrated in figure 1 (A-E). Assuming that the class with the lowest conditional mean of items indicated no depressive disorder, and other classes indicated certain depressive disorders in each model, to be compared with the classification identified by the cut-off value of CES-D10. The results of the ROC curve and kappa test are shown in Figure 1 (F) and Table 2. The kappa value of the 6-class model was 0.456, suggesting it has low consistency with the scale. The 5-class model and 3-class model had the largest area under the curve (AUC) and the kappa were 0.806 and 0.826 respectively. However, the 5-class model had a low-class number probability of 0.063 and 0.088, implying that these classes may have low practical significance, therefore, considering the model fit and interpretability, the current study selected the 3-class model as the optimal model. Given the conditional mean shown in Figure 1 (B), we define class 2 as “no depressive disorder” (0.692), class 3 as “mild depressive disorders” (0.122), and class 1 as “moderate to severe depressive disorders” (0.186).
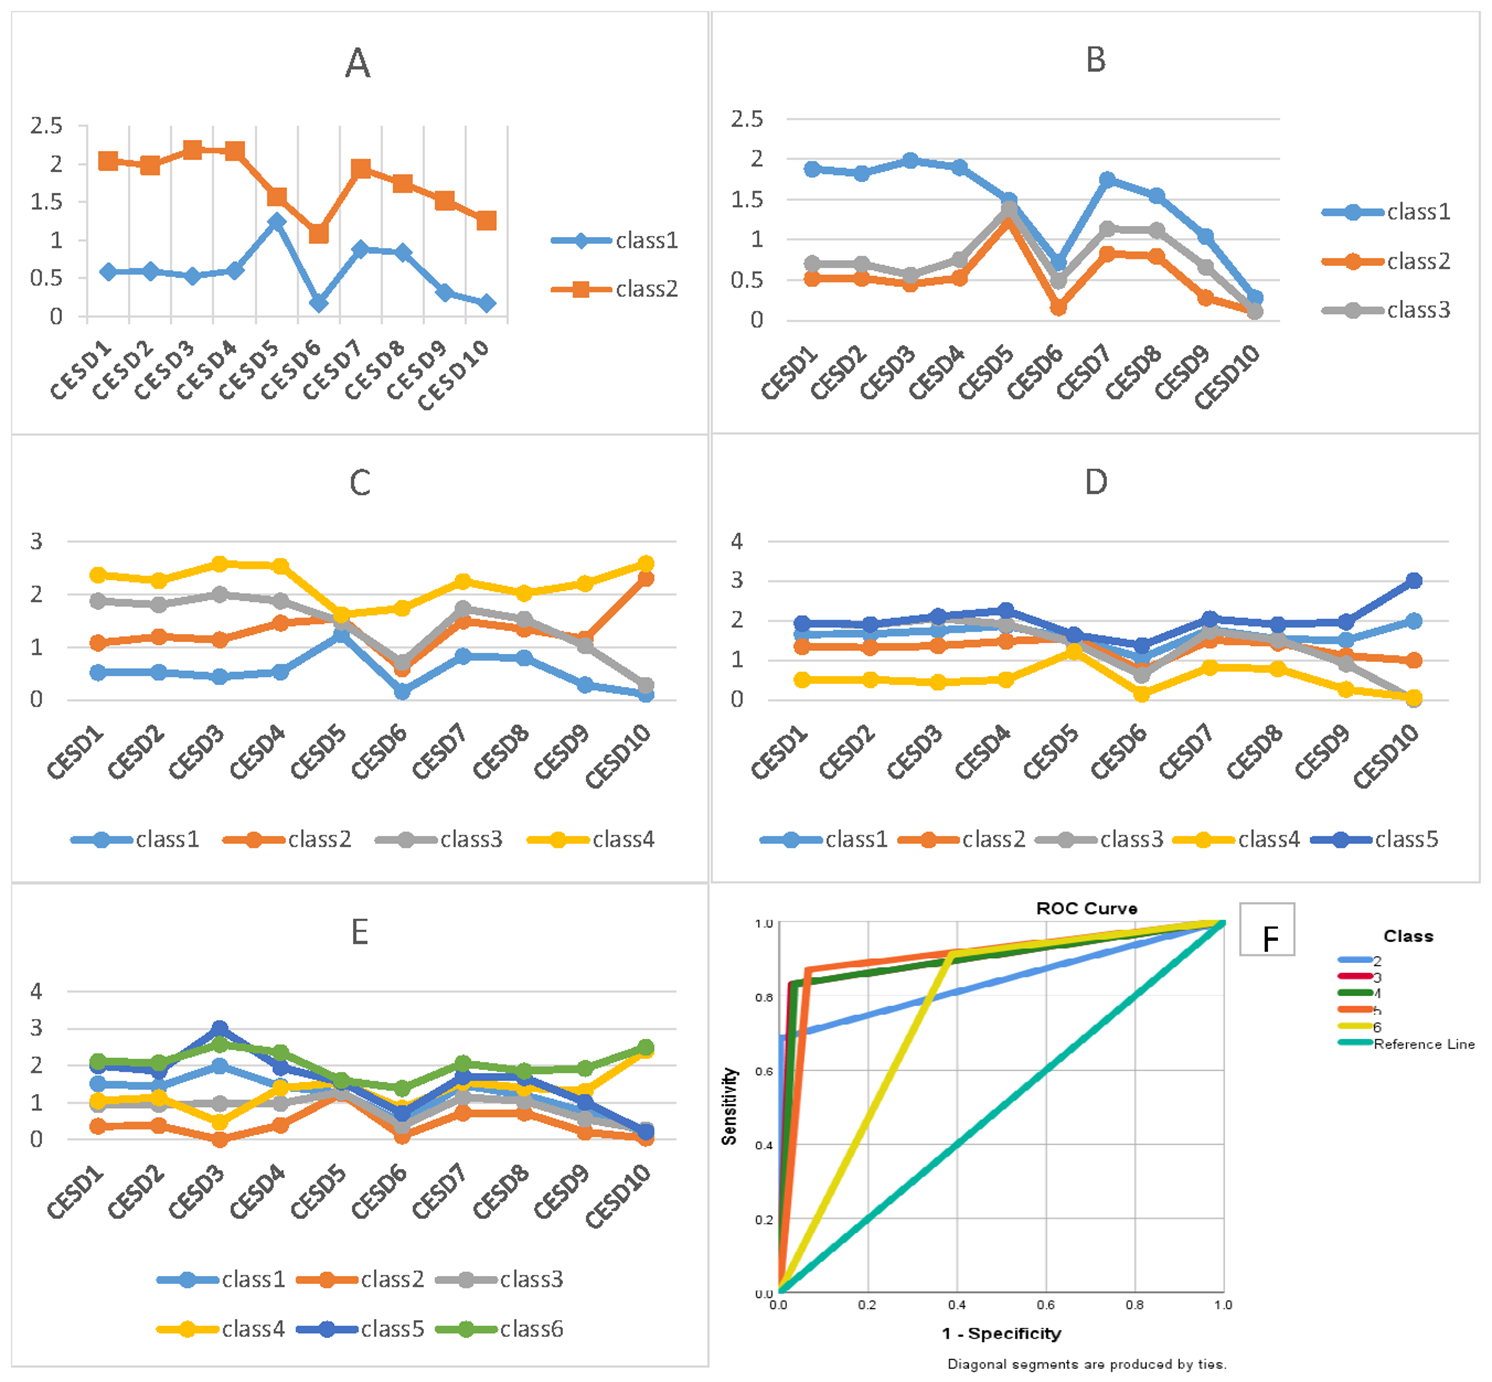
Note: in A-E, the x axis is 10 items of CES-D, the y axis is the conditional mean of each item on each class
Figure 1: Profiles of latent classes from 2-class to 6-class and receiver operating characteristic curve
Table 2: Test of area under the curve and kappa
|
class |
Area |
SE |
P |
Kappa |
|
2 |
0.842 |
0.004 |
< 0.001 |
0.737 |
|
3 |
0.902 |
0.003 |
< 0.001 |
0.826 |
|
4 |
0.899 |
0.003 |
< 0.001 |
0.818 |
|
5 |
0.903 |
0.003 |
< 0.001 |
0.806 |
|
6 |
0.762 |
0.003 |
< 0.001 |
0.456 |
Discussion
The current study suggested that 69.2 % of the Chinese elderly had no depressive disorder, 12.2 % had mild depressive disorders, and 18.6 % had moderate to severe depressive disorders. The conditional mean of item 6 (I felt fearful) and item 10 (I could not get “going”) were all similar and low in the 3 classes, indicating that the Chinese elderly seldom had a feeling of fear, and they thought they can continue their life anyway. On the contrary, the 3 classes had a similar and high conditional mean of item 5 (I did not feel hopeful about the future), implying that despite the intention to continue their life, the Chinese elderly could be worried and hopeless about their future yet. Hopelessness has been regarded as a risk factor for major depression [4]. Hence, the relative department could consider improving the hopefulness of the elderly, such as alleviating the discrimination towards them and enhancing their social support, to further prevent the occurrence or development of depressive disorders among the Chinese elderly [9].
The result of this study indicated that in the class “moderate to severe depressive disorders”, item 1 (I was bothered by things that don’t usually bother me), item 2 (I had trouble keeping my mind on what I was doing), item 3 (I felt depressed), item 4 (I felt everything I did was an effort), and item 7 (My sleep was restless) had higher conditional mean compared with other two classes, suggesting that the Chinese elderly with moderate to severe depressive symptoms usually experience anxiety, mindlessness, sadness, fatigue, and sleep disorders, which are all characteristic symptoms of depressive disorders [1,8,12]. The relative department could consider implementing psychological interventions such as mindfulness practice to alleviate these symptoms and reduce depressive disorders among the Chinese elderly [11].
Conclusion
This study identified three latent classes to characterize the depressive symptoms of the Chinese elderly, which could provide a reference for accurate intervention. researchers could continue to explore the characteristics of depressive disorders in the Chinese elderly and their influencing factors based on the findings of this study.
References
- AlSaeed S, Aljouee T, Alkhawajah NM, Alarieh R, AlGarni H, et al. (2022) Fatigue, Depression, and Anxiety Among Ambulating Multiple Sclerosis Patients. Front Immunol. 13: 844461.
- Andresen EM, Malmgren JA, Carter WB, Patrick DL (1994) Screening for depression in well older adults: evaluation of a short form of the CES-D (Center for Epidemiologic Studies Depression Scale). Am J Prev Med. 10(2): 77-84.
- Berlin KS, Williams NA, Parra GR (2014) An introduction to latent variable mixture modeling (part 1): overview and cross-sectional latent class and latent profile analyses. J Pediatr Psychol. 39(2): 174-187.
- Collazzoni A, Stratta P, Pacitti F, Rossi A, Santarelli V, et al. (2020) Resilience as a Mediator Between Interpersonal Risk Factors and Hopelessness in Depression. Front Psychiatry. 11: 10.
- Cui L, Ding D, Chen J, Wang M, He F, et al. (2022) Factors affecting the evolution of Chinese elderly depression: a cross- sectional study. BMC Geriatr. 22(1): 109.
- Dai Z (2022) Profiles of depressive disorders and influencing factors among the elderly in China: protocol for a secondary data analysis. Aging Commun. 4(3): 12.
- Huang Y, Wang Y, Wang H, Liu Z, Yu X, et al. (2019) Prevalence of mental disorders in China: a cross-sectional epidemiological study. Lancet Psychiatry. 6(3): 211-224.
- Li W, Ruan W, Peng Y, Lu Z, Wang D (2021) Associations of socioeconomic status and sleep disorder with depression among US adults. J Affect Disord. 295: 21-27.
- Mitchell UA, Gutierrez-Kapheim M, Nguyen AW, Al-Amin N (2020) Hopelessness Among Middle-Aged and Older Blacks: The Negative Impact of Discrimination and Protecting Power of Social and Religious Resources. Innov Aging. 4(5): igaa044.
- Radloff LS (1977) The CES-D Scale: A Self-Report Depression Scale for Research in the General Population. Applied Psychological Measurement. 1(3): 385-401.
- Slomski A (2020) Online Mindfulness Therapy Improves Residual Depression. JAMA. 323(12): 1124.
- Stein MB (2020) EDITORIAL: COVID-19 and Anxiety and Depression in 2020. Depress Anxiety. 37(4): 302.
- Tang T, Jiang J, Tang X (2022) Prevalence of depression among older adults living in care homes in China: A systematic review and meta-analysis. Int J Nurs Stud. 125: 104114.
- Yu SC, Lin YH, Hsu WH (2013) Applying structural equation modeling to report psychometric properties of Chinese version 10- item CES-D depression scale. Quality & Quantity. 47: 1511-1518.
- Zhao Y, Hu Y, Smith JP, Strauss J, Yang G (2014) Cohort profile: the China Health and Retirement Longitudinal Study (CHARLS). Int J Epidemiol. 43(1): 61-68.